Week of Dec 16th, S&P500 & Nasdaq, Tbond
Click to enlarge
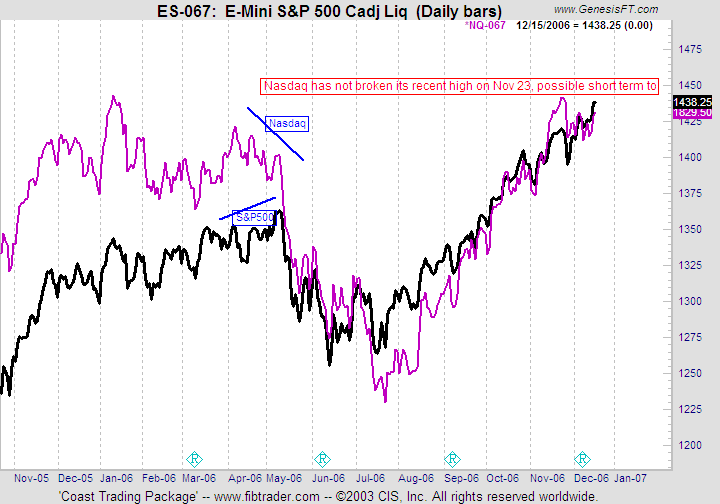
Stock Index Corner: S&P 500 & Nasdaq 100
The top chart above shows the comparison of the two major US indices. Do take a closer look at the last 2 weeks market actions and Nasdaq was not as strong as S&P 500 and has not broken it recent high on Nov 23 unlike the big brother S&P 500.
The May-June major correction was preceded by a series of lower high of Nasdaq while S&P was making a series of new highs. Would this repeat in the current bullish climate ?
Do watch closely the development of the two indices for more clues of future actions.
S&P500:
Big Picture: (monthly): Bullish
Medium term (weekly): Sideway to Moderately Bullish
Short term (daily): Sideway to Bearish
Fundamental:
The S&P 500 index has extended the July-Dec rally to a new 6-year high. The stock market has been supported most recently by the stronger than expected US Nov unemployment and retail sales reports, which have engendered confidence in the US economy and in continued firm earnings growth. The stock market is also being supported by the fact that oil prices have so far remained within their 2-1/2 month trading range and have not rallied above $65 per barrel. Despite the recent favorable news, US stock market investors are still worried about how earnings will hold up in 2007 with weaker GDP growth and how consumers will fare in 2007 with continued high gasoline prices, utility bills, and high debt levels.
Major World Indexes
Medium term: FTSE (UP), Nikkei (UP), ASX (UP)
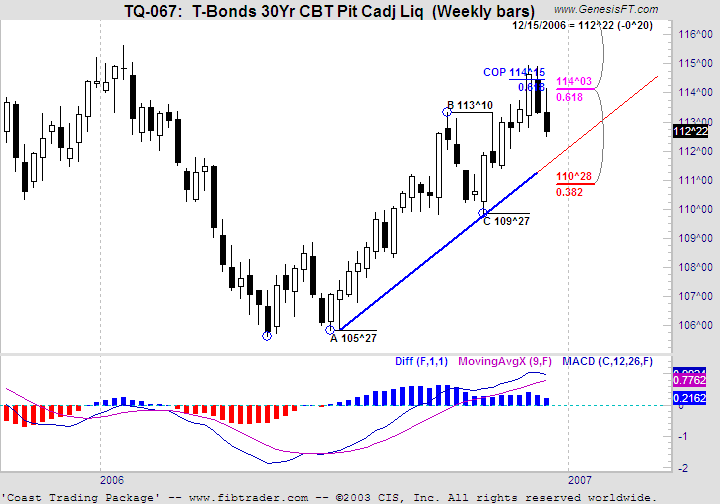
Commodity Corner: 30 Years Treasury bond
Technical:
The Tbond has hit the one important resistance target of 114-15 and also 0.618 of the retracement with the major high of June 005. It is verr likely the medium term downtrend will pursue.
Fundamental:
The 10-year T-note yield is currently near 4.60%, which is up sharply by 20 bp above the recent 10-month low of 4.40%. The Nov US retail sales report suggested that a relatively strong holiday shopping season is in progress and that there is little spillover consumer pessimism stemming from the weak housing market. The Nov payroll report of +132,000 was stronger than expected and Sep-Oct payrolls were revised higher by a net +42,000. The Nov unemployment rate rose by just 0.1 point to 4.5% from the 5-1/2 year low of 4.4% seen in Oct. The unemployment and retail sales reports convinced market participants that the US economy remains on track with GDP growth in the mid-2% area. The market responded by reducing expectations for Fed tightening by Dec-2007 to 50 bp from expectations as of Dec 1 for a 75 bp cut.
Trading ideas : (please do your own research and apply your profit/ risk management rules in all trades, please note except options writing, all the other trades may last just several days)
Writing Options: Tbond OTM Calls
Futures: Short British Pound
Stock Options: Long Orcl Puts, Long ALNY Puts
posted by "Frank" at Saturday, December 16, 2006
|
2 comments
![]()
![]()