Week of June 25th, Nikkei and S&P500
Click to enlarge
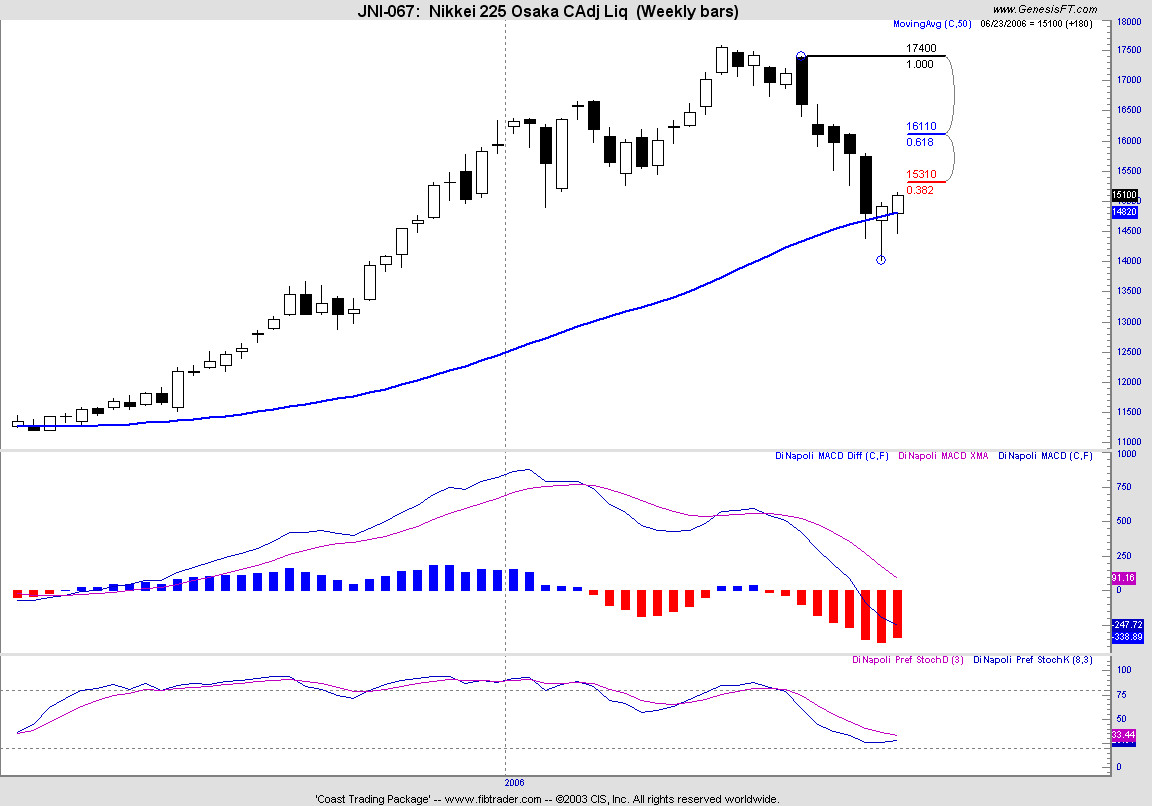
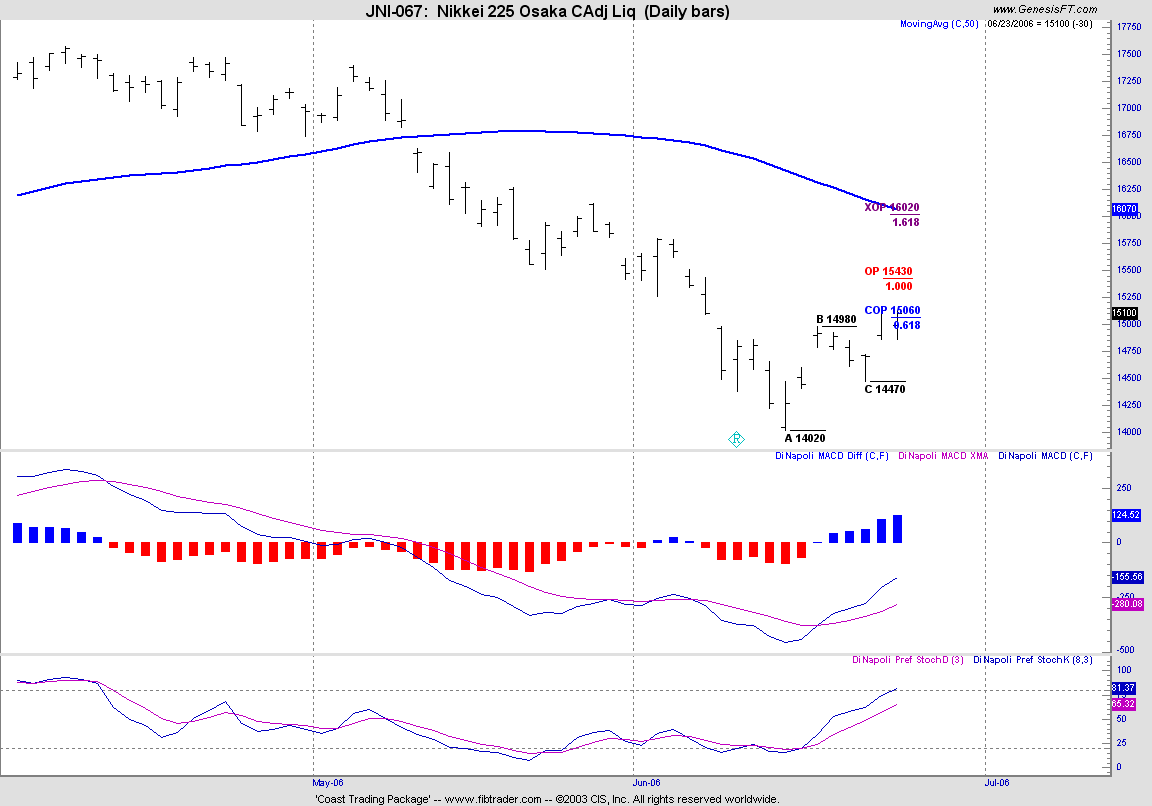
Nikkei:
The actions in the last one week has been most impressive vs other major indices. Daily higher low (uptrend) was confirmed on thursday with almost 500 points up. The current level is still far from the 50 days MA (stretched), possibly providing more room for the upmove until some stability is seen. Two possible targets for the upmove if continued: 15430 and 16028 (Sep futures)
The Weekly MACD Hist has finally turned up after 8 solid weeks of down move. This may lend support for further upmove for the daily NK.
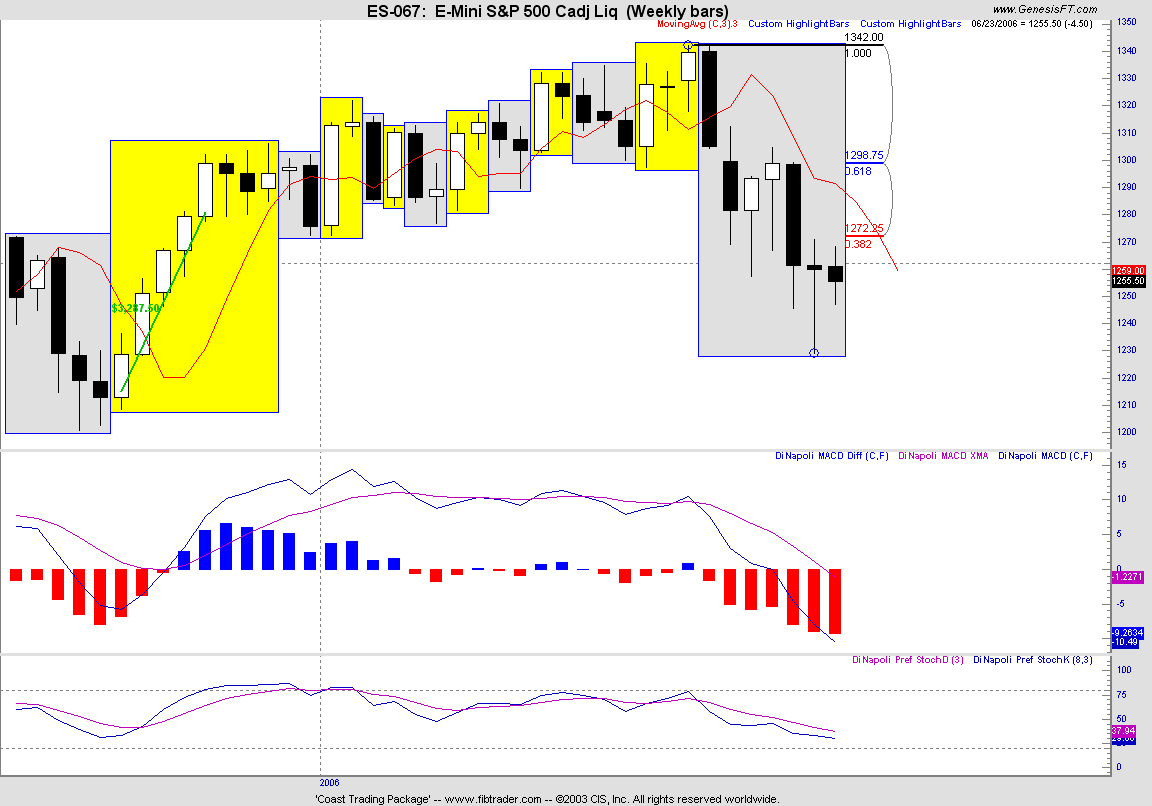
S&P 500:
The past week has seen some consolidation after a big surge in the prior week. The current pattern resembles a "triangle", an continuation pattern, a breakout is to be expected.
The Fed meeting scheduled on 29th will certainly provide the "fuel" for the next big moves..
http://www.mrci.com/reports.asp
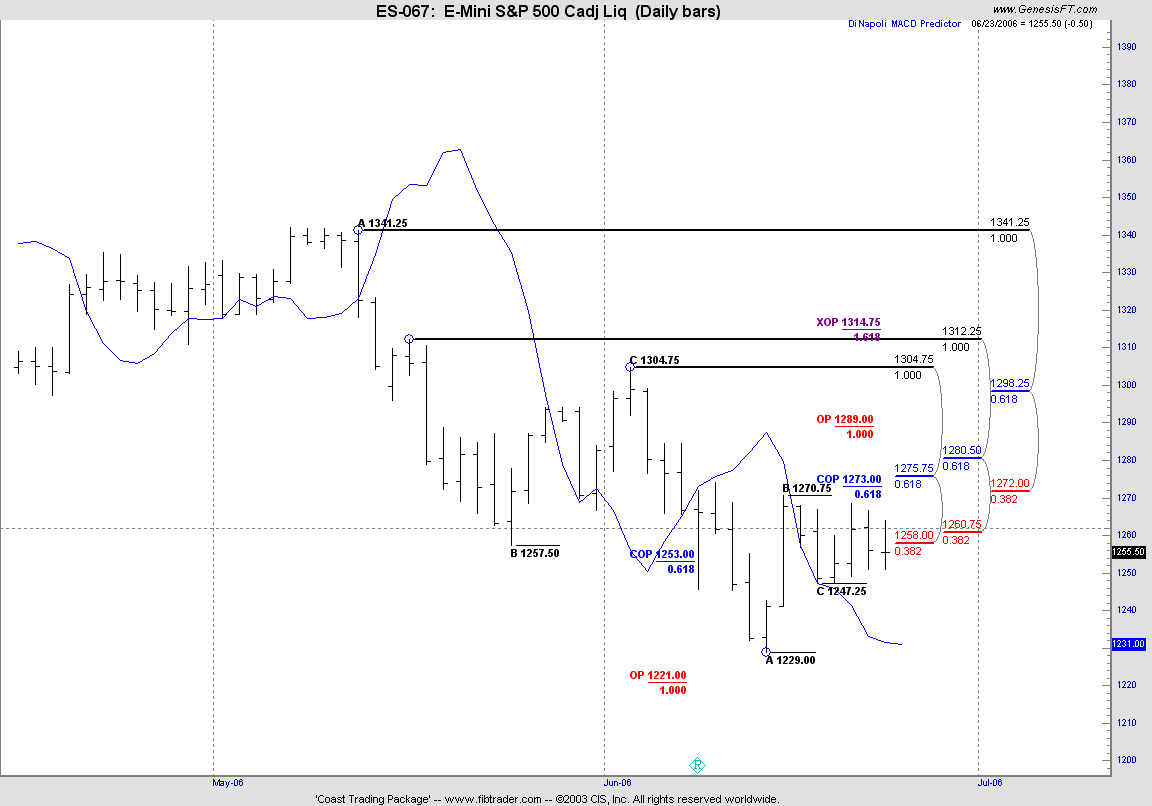
The levels to watch (emini S&P): 1273 (resistance) if broken will bring the market to 1300 level (0.618 of the bigger downmove) and 1220 (key support).
"Return of Bear Market" by Martin Pring (good read)
http://www.pring.com/articles/return.pdf
Big Picture: Long Term has not changed (monthly)...still bearish....
Medium term: Position to sell short on stock rallies..at key fibnode levels (S&P500:1298).
Short term: Possible short term uptrend next week..
Technicals: FTSE, Nikkei: Weekly MACD Histogram - Up (bullish) , ASX and S&P may turn up on weekly macd hist next week..
Trading ideas :
(please apply your risk management rules in all trades)
Rolling Options: Sell calls on Corns/ Cotton
Futures: Short Lean Hog, Long Sugar
Stocks Options: Long Puts (Tlab), Long Call (ABI)
posted by "Frank" at Sunday, June 25, 2006
|
0 comments
![]()
![]()