Week of Sep 3rd: S&P and Soybean
click to enlarge:
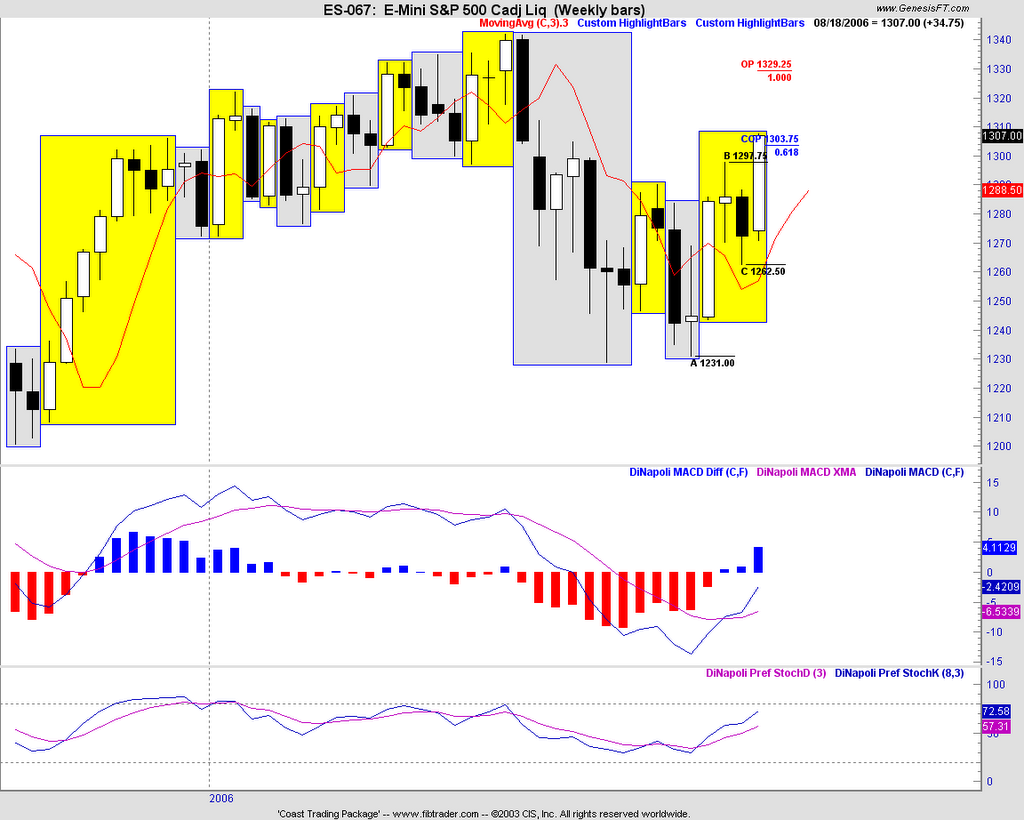
Stock Index Corner: S&P500
Fundamental
The S&P 500 forward P/E (based on forward-looking earnings) is currently at 14.95 whichis just mildly above the recent 11-year low of 14.27 posted in mid-June and keeps the stock market in a reasonable valuation light.
Technicals:
S&P stock index is still in a bull trend, indicated by the weekly MACD Hist. The corrections in the last few days after hitting COP 1303 level have not created any significant change in the medium term trend.
Next target is 1320 (Sep Futures) if it stays above 1300 this coming week.
Nasdaq has been outperforming the S&P for the last 3-4 weeks in percentage gains. This may help the broadmarket to sustain the current level for the bullish bias trend.
Big Picture: Long Term has changed (monthly)... Bullish....(The May low is now the higher low on the monthly chart). The traditional seasonal weakness in September may not eventualise. The May/June corrections could have been the weakest trend of the year. We shall see if this is true.
Medium term (weekly): Bullish
Short term (daily): Bullish bias
Weekly MACD: FTSE, SPX Nikkei, ASX - still UP (bullish)
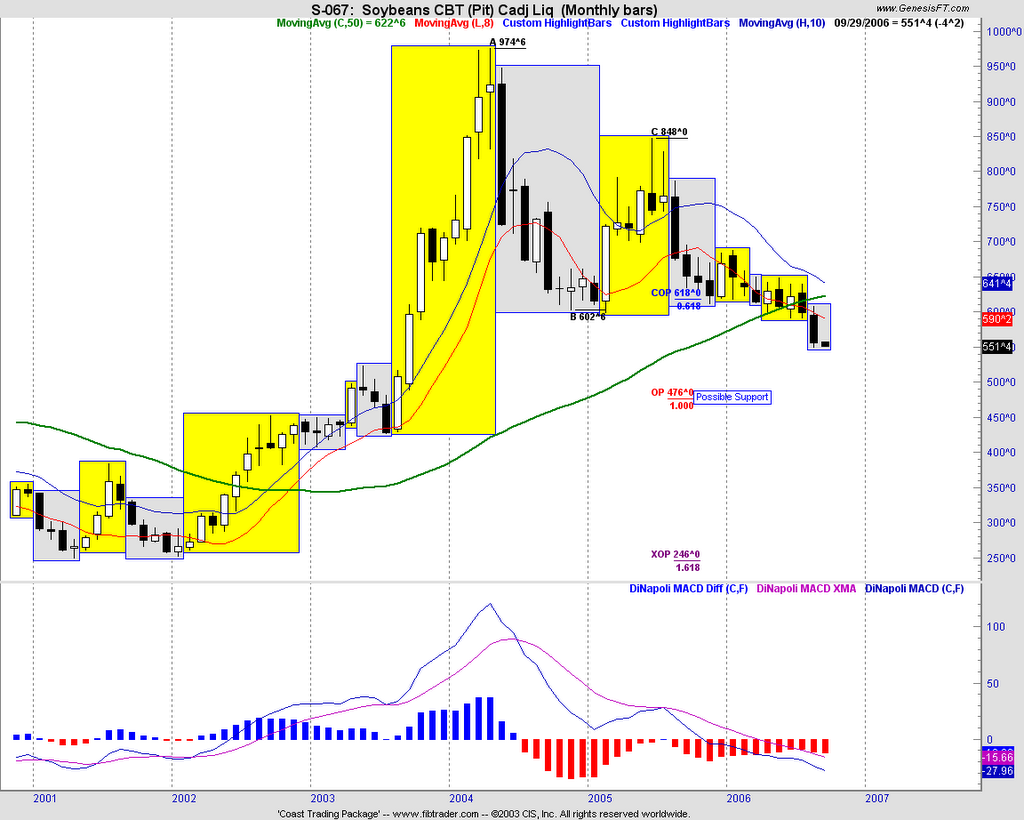
Commodities Corner: Soybean
Fundamental: (Source: CRB)
SOYBEANS—Nov soybean prices in the past week fell another
notch to a new 18-month low, thus extending the summer plunge to
about 70 cents per bushel (-11%). The USDA’s Aug crop report
showed a -5.1% yr/yr decline in the soybean crop and a -12.6% decline
in the US carry-over. However, the weather during the critical
August pod-filling season has been ideal and the USDA will undoubtedly
revise its crop size and carry-over figures higher. Indeed,
soybean’s good-to-excellent rating appears to have bottomed
out and has moved higher by 6 percentage points in the past 3
weeks to 59%. Large specs had a large short position of 41,425 as
of Aug 22. Soybean summary: 2006-07 crop 2.928 bln bushels
(-5.1% yr/yr), 2006-07 US carry-over 450 mln bushels (-12.6% yr/
yr), 2006-07 global carry-over of 49.970 MMT (-6.5% yr/yr).
Technicals:
Monthly chart (above) showing continued downtrend driven by poor fundamentals and next possible support is 476 (S Nov futures)
Trading ideas : (please apply your risk management rules in all trades)
Writing Options: Soybean OTM calls
Futures: Short Orange Juice, Short Bean Oil
Stock Options: OIH (long call), EXPE (long call)
posted by "Frank" at Sunday, September 03, 2006
|
2 comments
![]()
![]()