Week of July 9th, S&P and Nasdaq (They are not enjoying the "party" together..)

Click to enlarge...
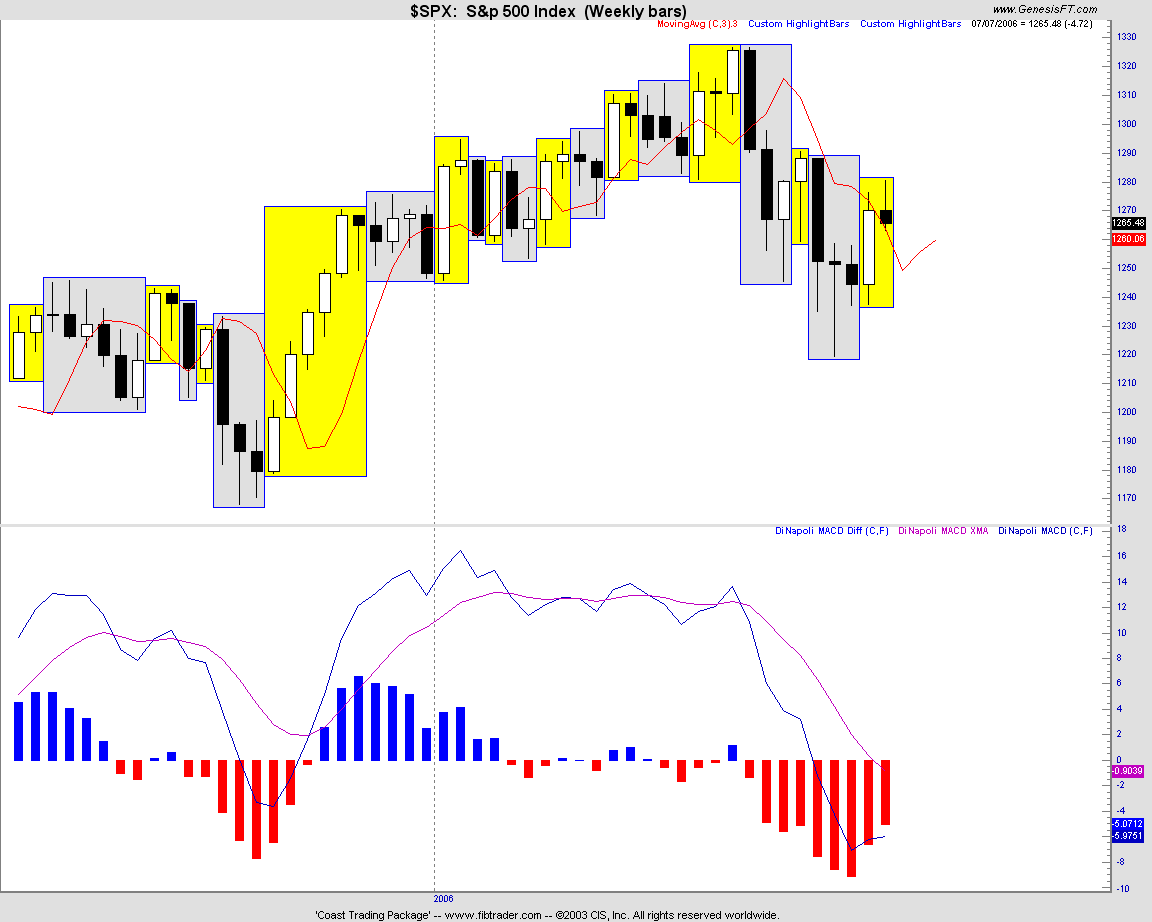
S&P 500: The last 2-3 weeks rally may have run its course.....It could not rally above 1298, one of the key fibnode level (0.68 of the major corrective wave) ...a sign of weakness..
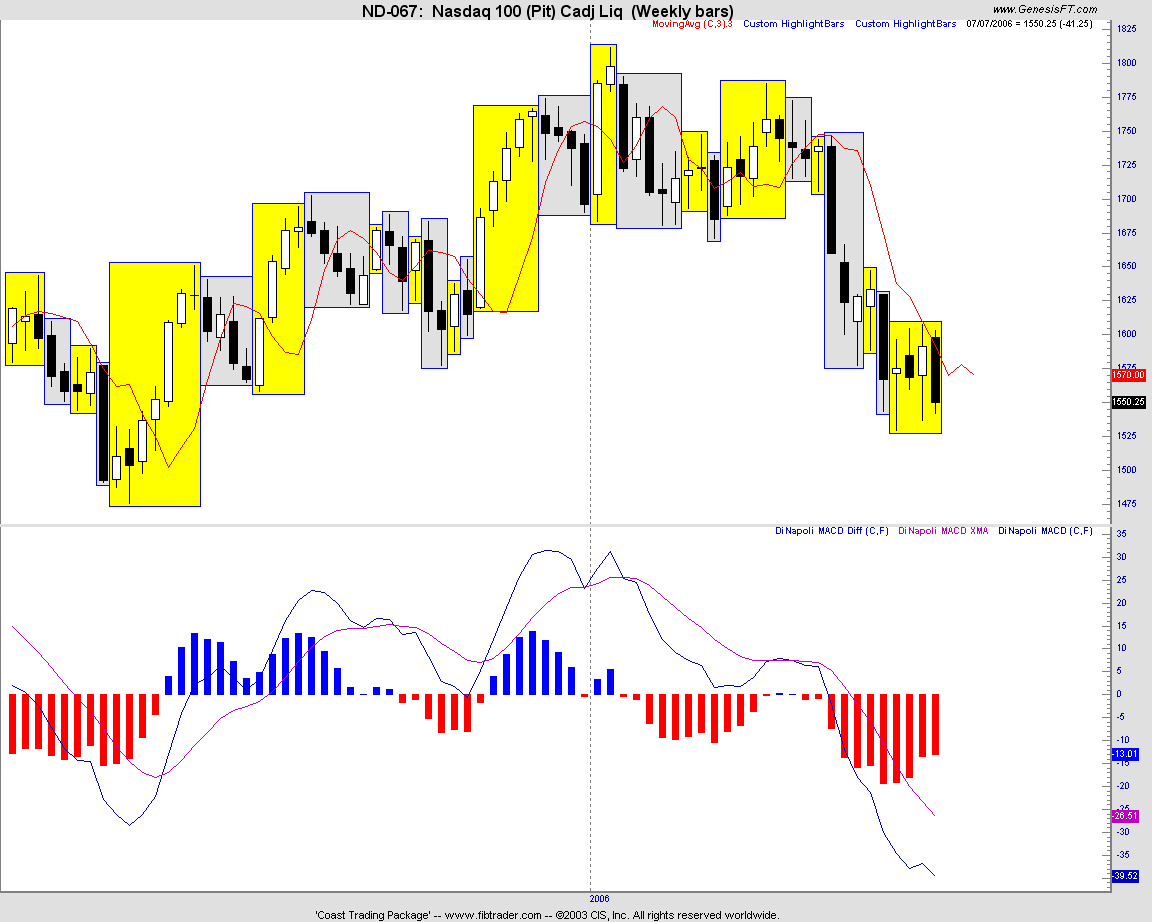
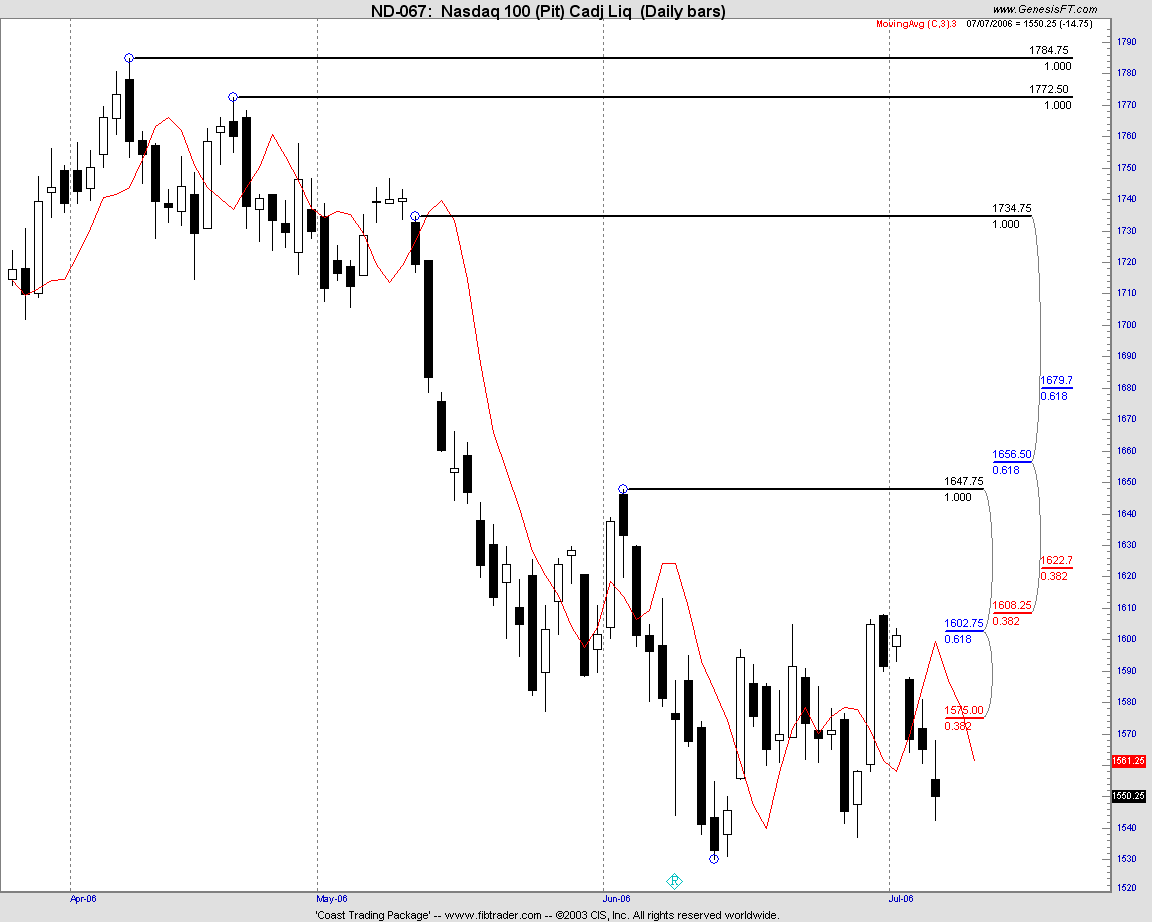
Nasdaq 100: The above charts show some real problems for the Nasdaq 100 stocks, and it only touched 0.382 of the major corrective wave and clearly weaker than its big brother S&P. This is also a sign of divergence, similar to late April to early May pattern, where Dow Jones/ S&P were moving to new high but Nasdaq were trending lower instead.....The Nasdaq weakness may just pull down the big brother along....this can be an important sign of the impending down move of the broad market....the coming earnings quarter may be the catalyst for the next big move...the question is: North or South.....?
Big Picture: Long Term has not changed (monthly)... bearish....
Medium term: MT trend may change to bearish bias...Position to sell short on the recent stock rallies....
Short term: Downtrend may start its course the coming week, in sync with the medium and long term downtrend
Technicals: FTSE, Nikkei, ASX, S&P's Weekly MACD Histogram (WMH) - Up (But this coming week WMH may have high possibility to turn down in line with the long term downtrend...keep a real close watch...!.)
Trading ideas :(please apply your risk management rules in all trades)
Rolling Options: Sell OTM calls on S&P, Sell OTM puts on Bean Oil..
Futures: Long Treasury bond, Short Orange Juice
Stocks Options: Cat (long puts), ATI (long puts)
posted by "Frank" at Monday, July 10, 2006
|
0 comments
![]()
![]()