Week of Aug 6th, Tbond and S&P


Click to enlarge:
Tbond:
The Sep Tbond has rallied for the past 6 weeks anticipating pause of Fed fund hikes.
Technically, the Tbond has more room to move on the upside, but this coming week may give the bulls a chance to take a breather..The FOMC mtg may give it a another rally, and 110-23 is the next target.
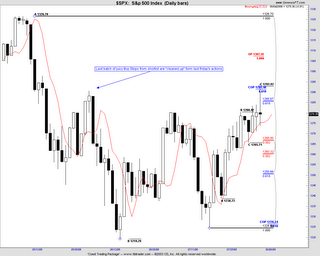
S&P500: The market as anticpated had rallied last week but last friday's actions spell trouble for the bulls.....The buy stops placed by all the shorts in the last 2-3 months have been "cleaned up", ie "wash and rinse" which means the market is now healthier for the shorts....if coming monday closes lower than the last friday's low, this may give us high possibility of next down move..
Big Picture: Long Term has not changed (monthly)... Bearish....(possibility forming lower high on the monthly chart....)
August has been known as the worst S&P month in the last 15 years..(Stock Almanac, Hirsch)
Medium term: Weekly, though technically bullish, but directional pattern indicates otherwise, bearish bias...
Short term: Bearish...
Technicals: In order of bullishness, FTSE, SPX Nikkei, ASX, Weekly MACD Histogram (WMH) - still UP (bullish), but may turn down this week.....
Trading ideas :(please apply your risk management rules in all trades)
Writing Options: Tbond (OTM puts)
Futures: Long Live cattle
Options: SBC communication, T, (long call)


0 Comments:
Post a Comment
<< Home